Edit chart
Loading graph
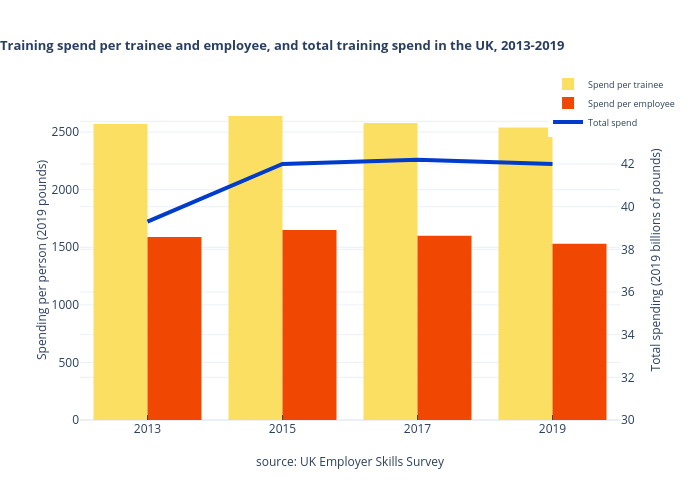
Michelezanini's interactive graph and data of "Training spend per trainee and employee, and total training spend in the UK, 2013-2019" is a grouped bar chart, showing Spend per trainee, Spend per employee, Total spend; with source: UK Employer Skills Survey in the x-axis and Spending per person (2019 pounds) in the y-axis.. The x-axis shows values from -0.5 to 3.5. The y-axis shows values from 0 to 2778.9473684210525.